What Are Standard Energy Use Intensity Benchmarks?
By Cem Alptekin, Iota Communications
In business, the concept of benchmarking—comparing one company's performance against that of competitors—is a widely accepted, and even promoted, practice because of its effectiveness in moving the organizational performance needle. Not only is it a good motivator for making positive changes, but it also offers guidelines for performance where there may not be any otherwise.
The same is true for energy use intensity (EUI) benchmarking. There are no definitive "good" or "bad" numbers for energy use—there's only the collective wisdom of what everyone else is doing. And that could be just the ammunition you need as a facility manager to get others on board in your efforts to become more energy efficient.
This article answers the question, "What is energy use intensity?", mentions some things to consider in terms of benchmarking, and discusses what to do with your benchmark data once you have it. It also includes some average EUI data by building type.
What is energy use intensity?
According to the Energy Star program, energy use intensity, or EUI, is defined as energy used per square foot of a property per year. It can be calculated with the following energy use intensity formula:
Total energy used per square foot per year/Total gross floor area of the building = Energy use intensity
How To Benchmark Energy Intensity
For benchmarking purposes, energy use information can easily be found on your utility bills; it is listed as kilowatt-hours (kWh) for electric power and in therms for natural gas. That information can then be inputted into a website like the EPA's Energy Star Portfolio Manager, which converts it into kilo-British thermal units, or kBtu (To convert your power usage to kBtus yourself, multiply your total energy consumption in kWh by 3.412.) So if a 20,000-square foot building uses 8 million kBtu per year, its EUI is 400 (8,000,000 ÷ 20,000).
The Energy Star site will give your building a "score" from 1 to 100, but it's important to remember that your EUI number on its own can't be evaluated in a vacuum. In general, each industry's intensity level is a factor of:
- Reliance on certain types of equipment for successful operation
- The energy required by those types of equipment
- Hours of operation
Taking these three factors into consideration means that buildings should be benchmarked against other buildings within the same industry for apples-to-apples comparisons. For example, the food service industry is the most energy-intensive industry of all because it uses equipment such as refrigeration systems and cooling processes 24/7. A food service building could not be meaningfully compared to a school, which operates only part of the day and has lower energy requirements for operation.
According to the Department of Energy, the five most energy intensive industries are:
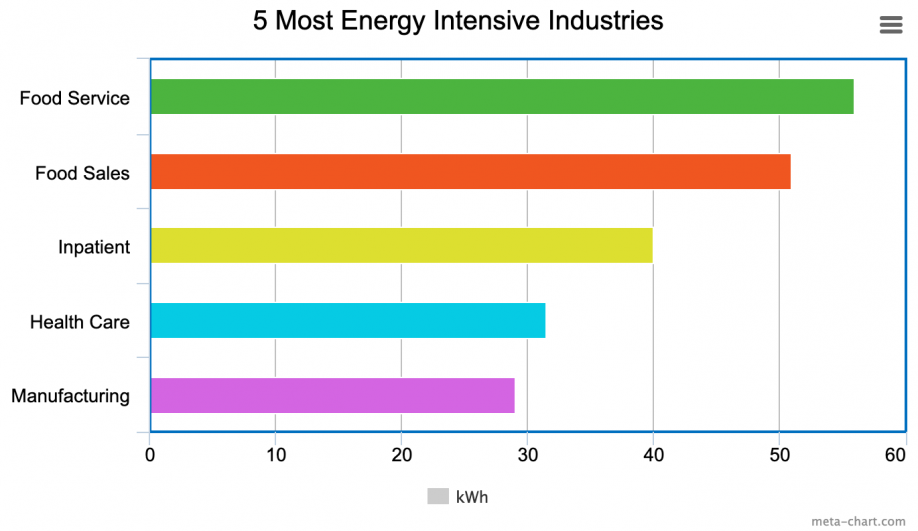
You can find the US national median EUI for your property type here.
In addition to industry, climate and weather also play a role in energy benchmarking. It would be difficult to compare buildings in Vermont and Florida because of their different climates. Also, if you plan on benchmarking your own building's performance over several years, the weather could differ dramatically from one year to the next, requiring weather normalization, or the calculation of energy use based on average weather conditions.
Making Data Comparisons
Examining your EUI data against that of similar buildings gives you a reference point with regard to energy use. Examine the following:
- How does your energy use and profile align with that of comparable buildings?
- How do you stack up against the average building?
- How does each of your system components, like lighting or refrigeration, compare to the industry standard?
- If you own multiple buildings, compare energy usage across all your properties—how do they compare?
Areas that seem significantly different than the average are good places to target for improvements. And even if you seem to be doing well already, there are likely still energy-saving opportunities you can take advantage of.
Energy Use Intensity Benchmarking: Voluntary Or Mandatory?
While EUI benchmarking is a voluntary activity in many places, some cities are beginning to implement it as a requirement. The city of St. Louis, Missouri, for example, created a building energy awareness ordinance that went into effect in 2017. It requires buildings of 50,000 square feet or more to be benchmarked, and says owners must disclose annual energy and water consumption. Initial findings from its first compilation of the results indicate that the top four energy consuming building types were offices, hotels, multifamily housing, and hospitals; it also notes that municipally-owned buildings are performing better than privately-owned buildings.
New York City's Local Law 84—the Benchmarking Law—also requires large buildings to submit yearly data on energy and water usage. Penalties are enacted for buildings that do not comply.
Even if your town or city doesn't require energy use intensity benchmarking, you'll benefit from doing so voluntarily. Why? Because understanding your current energy performance is the only way to become more energy efficient.
What comes after benchmarking?
Having identified areas for improvement, you can next begin to form a targeted strategy to address them. In order to do so, you'll need data—granular information about your building's daily energy consumption.
This type of data can be gathered with the help of the Internet of Things (IoT). Wireless IoT sensors placed throughout your building collect real-time energy information, for example, how much energy is consumed by specific machines or motors, or systems like lighting and HVAC. The more data you have, the more insights you'll get about the specific factors that influence your consumption level. Armed with data, you can take two important steps:
- Use it to benchmark specific facets of your building operation. For instance, how much energy does your building consume for refrigeration? Lighting? HVAC? And how does that compare to the industry standard? (Download our Energy Benchmarking Report for more detailed data about industry energy consumption.)
- Develop energy efficiency strategies that will improve your building's operating efficiency. The advanced analytics tools provided by most IoT monitoring systems produce more insights about your building than would be possible otherwise. As a result, you can take immediate steps to improve your operating efficiency.
Need help making sense of your energy intensity benchmarks?
Iota partners with buildings in all industries to help them achieve their energy efficiency goals, and it all starts with benchmarking. We can help you compile and analyze your energy profile, and provide an IoT solution to get you started with granular data collection.
And while it might seem like energy intensity benchmarking only leads to costly "fixes," it doesn't have to be that way. We've helped many building owners make changes (like switching to LED lights or implementing demand control ventilation) that are not only low in cost but have a high return on investment, so you'll realize savings sooner than you think. We can also recommend creative strategies (such as changing the scheduling of some building operations) that would have a big impact on your utility bills.
If you're interested in learning more about benchmarking and IoT data collection for your facility, talk to us—we'd love to help!