While each instance of shading is unique and can affect power production to varying degrees, there has been little investigation into whether shading of a single string happens in isolation, or whether it also affects neighboring, non-shaded strings and modules.
Aerial Thermography Findings from the Field: The Lesser-Known Impact of Shading on Power Production
Charlie Davies | Raptor Maps
PV module shading comes from a wide variety of sources, including trees, ground vegetation, soiling, adjacent rows, and debris. While each instance of shading is unique and can affect power production to varying degrees, there has been little investigation into whether shading of a single string happens in isolation, or whether it also affects neighboring, non-shaded strings and modules within those strings.
Raptor Maps, in partnership with the University of Louisiana at Lafayette (UL Lafayette), conducted a set of experiments at the 1.1MWdc Louisiana Solar Energy Lab (LaSEL) to look into how module shading affects the power production of surrounding equipment. We found that hot spots emerged on an adjacent string as a direct result of module shading. These hot spots appear as a result of the shading impacting the Maximum Power Point Tracker’s (MPPT) optimal current and voltage.
In this experiment, Raptor Maps first conducted a IEC compliant Raptor Comprehensive level aerial thermography inspection in order to establish an accurate record of all defects, including instances of PV module shading. To control for other factors, Raptor Maps conducted the experiment on a nominal string so there was no interference from underlying hot spots or other defects.
The experimental area consists of polycrystalline modules configured with 18 modules per string and two strings per Maximum Power Point Tracker (MPPT). Inverters in this area consist of 30 kW string inverters in a 6-string configuration.

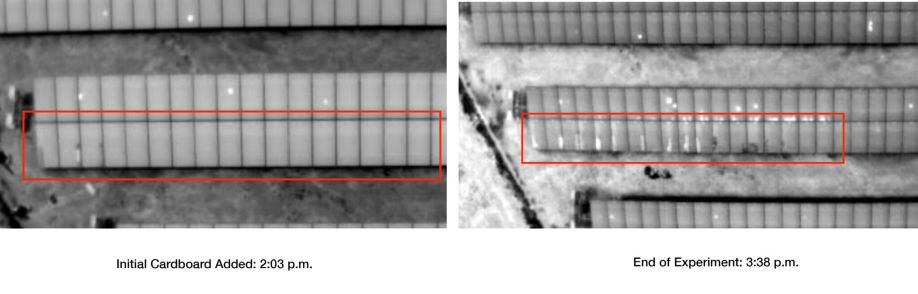
Raptor Maps systematically covered sections of modules within the same string with pieces of cardboard large enough to activate bypass diodes. Throughout this process, a drone with a radiometric thermal payload captured IR imagery in order to monitor the emergence of additional hot spots, as well as specific temperature delta calculations of modules in the adjacent string. Calculating temperature deltas following the addition of each piece of cardboard allowed for precise monitoring of the effects of changing the MPPT’s power curve.

Increasing hot spot severity as a result of activating bypass diodes in neighboring string
Between these measurements and visible observations in IR imagery, it is clear that increasing the amount of shading within one string has a negative impact on power production of not only the shaded string but also of an adjacent, non-shaded string. Shading of only a small percentage of modules in this instance can have a large impact on the optimal DC current and voltage for each string input. The non-shaded adjacent string had to operate a non-optimal voltage and current, resulting in temporary hot spots. It is important to note that this impact on production is in many cases likely not considered during system performance modeling.
Further, in addition to temporary hot spots, prolonged shading can result in burned-out cells, bypass diode failure, or fire in the most severe instances in the shaded modules. Long-term shading can also cause advanced degradation and aging of PV modules. Raptor Maps aggregate findings indicate that shading, particularly from vegetation, is one of the most consistent and prevalent anomaly types identified year after year, amounting to many MWs of annual power losses across the dataset. Based on these findings, it is highly recommended that shading be treated as a priority and quickly remediated.
This article was written by Charlie Davies, the Technical Specialist at Raptor Maps, in partnership with the University of Louisiana at Lafayette (UL Lafayette).
The content & opinions in this article are the author’s and do not necessarily represent the views of AltEnergyMag
Comments (0)
This post does not have any comments. Be the first to leave a comment below.
Featured Product