SEPA Utility Solar Snapshot Highlights Growth and Resilience in Uncertain U.S. Market
Long-dormant non-residential sector takes off with 49% increase
WASHINGTON, D.C. -- Taking longer-term trends into account, a new report from the Smart Electric Power Alliance (SEPA) argues that -- a drop in megawatts notwithstanding -- the U.S. solar market did not contract last year. Rather, the 2018 Utility Solar Market Snapshot sees 2016s growth spike as an outlier in the industrys decade-long pattern of steady, continuing expansion.
"The expected sunsetting of the federal investment tax credit -- which happily did not occur -- really accelerated the market in 2016," said Daisy Chung, Research Manager and lead author of the report. "But, without the spike, we saw upward growth from 2015 to 2017 repeated across most regions and market segments."
Now in its 11th year, the Utility Solar Market Snapshot is the only industry report based on interconnection data and market insights obtained directly from more than 400 utilities across the country, Chung said. This years edition drills into the signs of resilience -- such as the doubling of community solar capacity -- and potential challenges SEPA found amid concerns about market decline and uncertainty. (Please note, all figures in the report and this release are in alternating current (ac) unless otherwise noted as direct current (dc).)
For example, a SEPA analysis shows that the solar tariffs enacted by the Trump administration in early 2018 will have minimal impact on near-term solar prices. But a more significant price increase could occur when the step-down in the 30-percent investment tax credit begins in 2020.
Other key takeaways include:
• Of the 42 gigawatts (GW) of solar that U.S. utilities have interconnected to the grid since 2007, 7.4 GW -- 18 percent of the total -- were added last year. Solar now represents, on average, 3 percent per month of all U.S. electricity generation.
• Non-residential solar -- long the slow-moving, dormant sector of the U.S.market -- took off in 2017, posting a 49-percent increase over 2016.
• Community solar more than doubled last year, from a cumulative capacity of 347 MW-dc in 2016 to 737 MW-dc in 2017. More than half of the new capacity for 2017 -- 246 MW -- is concentrated in one state, Minnesota.
• The drop in the federal corporate tax rate -- from 35 percent to 21 percent -- could put a damper on tax equity investment in utility-scale solar. Tax equity investment decreased about 11 percent, from $4.4 billion in 2016 to less than $4 billion in 2017.
• Utilities increasingly see solar as part of a portfolio of DERs with multiple customer and grid benefits. More than half of those responding to specific survey questions are interested in, planning or have deployed solar-plus-storage or advanced inverter projects.
The 2018 Utility Solar Market Snapshot is the first of three Snapshot reports based on data from SEPAs 2018 Utility Survey. Upcoming reports will include the 2018 Utility Energy Storage Market Snapshot and the 2018 Utility Demand Response Market Snapshot.
You can download the Solar Market Snapshot here. To receive alerts on the Storage and Demand Response Snapshots, email communications@sepapower.org.
About SEPA
The Smart Electric Power Alliance (SEPA) is an educational nonprofit working to facilitate the utility industrys transition to a clean energy future through education, research, standards and collaboration. SEPA offers a range of research initiatives and resources, as well as conferences, educational events and professional networking opportunities. SEPA is founder and co-sponsor of Solar Power International and winner of the Keystone Policy Centers 2016 Leadership in Energy Award. For more information, visit www.sepapower.org.
Featured Product

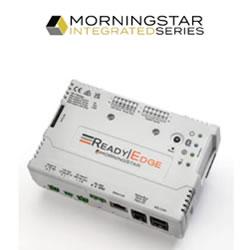
MORNINGSTAR - ReadyEdge
The ReadyEdgeTM (RE-1) accessory is an intelligent system controlling and reporting device meant to make monitoring your solar energy system more transparent. Enabling access to LiveViewTM 2.0 and Morningstar Solar ConnectTM, ReadyEdge provides data from all compatible Morningstar devices in your system. It is designed to be paired with the three ReadyBlock options, up to six total, with the possibility to use multiple ReadyShunts and ReadyRelays. The ReadyEdge is compatible with select Morningstar products.
