By offering a means to install a solar power system without the initial capital, Power Purchase Agreements could be the Holy Grail for mass market adoption of solar. After being a major driver of solar installations over the last couple years, however, a number of obstacles still stand in their way. What makes these instruments so attractive?

Aaron Chew | SustainableWorks NYC
By harnessing the limitless energy generated by the sun every day, solar power not only provides a potential means to free the world from its asphyxiating addiction to fossil fuels but also a unique ability to produce free energy. Of course, while the cost of generating solar power may be zero, the price of solar equipment is extraordinarily expensive. In fact, at close to $25,000 for a single-family house or $4.5 million for an average Wal-Mart store, the upfront cost of installing a solar power system can be prohibitively high.i
By offering a means to install a solar power system without the initial capital, however, Power Purchase Agreements could be the Holy Grail for mass market adoption of solar. After being a major driver of solar installations over the last couple years, however, a number of obstacles still stand in their way. What makes these instruments so attractive? And why are they not available for everybody? What is driving growth in this market, and what might hold it back? Will PPAs be panacea for solar financing? This report aims to answer each of those questions and address what it will ultimately take for PPAs to drive solar power from a niche to the mainstream.
PPAs Bring Solar Power to Homes & Businesses without the Upfront Cost
An average single-family house requires a solar power system with a capacity of between 2 and 4 kW.ii Assuming a recent quote of about $8.50 per watt, a 3-kW residential system would require an upfront investment of roughly $25,000 before the household receives any of the cost-saving benefits of free solar power generation.iii Commercial installations demand much higher capacity. Even assuming a lower installation cost of $4.00-5.00 per watt, the total cost of a 1-MW commercial or industrial system would range between $4 and 5 million. Assuming the full benefit of tax incentives and sufficient savings from a lower electric utility bill, the payback period for the installation cost could be as little as five to eight years.iv However, lower electricity prices and/or an inability to fully capitalize on all potential tax incentives could stretch that out to more than 15 years.v In sum, while the installation of solar power would almost certainly translate into material savings—both environmentally and economically—the precipitously high upfront cost and potentially lengthy payback period serve as material impediments to deeper penetration of solar power throughout the US.
More commonly referred to as a “PPA,” a power purchase agreement aims to overcome this hurdle. A PPA simply refers to a long-term contract between two parties in which one party sells electric power to the other. Though this financial arrangement has been used by the coal, oil, natural gas, and utility industries for decades, it has the potential to be a major game-changer for the solar power sector because it overcomes what is arguably the largest obstacle to more widespread solar installations: the high upfront cost of installation.
A 1-MW commercial installation at a big-box retailer, such as a Wal-Mart, presents a useful illustration. An operation of this size might use upwards of 500,000 kWh of electricity on average per month.vi At an average utility rate of $0.11 per kWh for commercial customers, this would translate into a normal monthly utility bill of about $55,000, or about $660,000 per year.vii If Wal-Mart were to self-finance a solar system at an all-in cost of about $4.50 per watt, it would have to come out of pocket for the entire $4.5 million before receiving any of the financial benefits.viii Under a PPA arrangement, however, the PPA provider would arrange 3rd party financing in order to cover the entire $4.5 million installation cost, and the customer would circumvent the need to make an initial capital investment. In return, Wal-Mart pays the PPA provider for the power the system generates every month over the life of the contract, which is usually 20 years but can be as little as 10 years in length. Since PPAs are designed to replace one’s electric utility bill, rates are usually set in line or at a slight discount to the local utility rate; these rates are usually fixed or escalated annually at a typical rate of between 1-4%.ix
Of course, since solar power is only capable of generating electricity during daytime hours when the sun is out, this installation will not entirely replace Wal-Mart’s utility bill but instead offset a portion of it. On the whole, a commercial installation like this usually covers about 30% of the customer’s total electricity needs.x In this case, that would mean Wal-Mart would still be on the hook for a $462,000 monthly bill from its local utility. If its PPA rate was set at a discount of 10%, its PPA bill would total a little more than $178,000 and total savings under the PPA when compared to its original utility bill would be approximately $20,000, or almost 3%. As a result, on top of avoiding the upfront capital investment, Wal-Mart may also benefit from ongoing savings on its electricity bill, though the magnitude of those savings is ultimately a function of growth in electricity prices. If electricity rates grow like they did between 2005 and 2008, when they jumped 25-30% in most states, savings would be much higher.xi
A Win-Win Solution Benefits Both the PPA Customer and Provider
The primary reason this arrangement is so viable is that it is symbiotically beneficial to both sides of the table. For the PPA customer, the benefits are both financial and qualitative. They can be summarized as follows:
-
No Upfront Cost of Installation: First and foremost is the avoidance of the capital cost of installation. Not only does a customer need sufficient cash on hand to pay for the system, but it will also suffer the opportunity cost of not investing the capital in its own business, which given its expertise in the area, should in theory yield a higher return on investment.
-
Visibility and Predictability of Future Electricity Costs: Local utility rates are subject to the volatility of the market prices. After growing at less than 1% a year between 1990 and 2003, commercial electricity rates jumped to a 6% compounded rate of growth through 2008.xii Such volatility makes budgeting and cash flow forecasting extremely challenging for businesses, while leading to unpleasant surprises for residential customers. PPAs not only provide their customers with extended visibility into future electricity expenses but also immunity from exposure to rising energy prices for decades to come.
-
No Maintenance Costs or Operating Risk: Given the assorted variables that impact the performance of solar power—such as weather or degradation— one of the biggest risks of a solar power system is under-production, which could add up over time and possibly extend the payback period. Under a PPA, however, customers usually only pay for the energy produced; in some cases if the system underperforms, the shortfall is even refunded. Moreover, the PPA customer is not subject to any maintenance costs.
-
Simplified Execution: Furthermore, the complexity of installing a solar power system is not to be overlooked. Because of the extensive red tape required for each solar installation, the average cost of paperwork in a solar project is estimated at $1/watt.xiii Aside from the design and integration, the PPA providers handle all of the paperwork necessary to secure the permits and appropriate tax incentives and rebates.
-
Lower Monthly Electricity Bill: As cited above, some PPAs may be priced at a discount to local utility rates, which would offer incremental savings. As an example, SunRun’s residential PPAs offer fixed rates at a discount between 5-20% off the local utility rate.xiv
-
Reduction in Greenhouse Gas Emissions: Last but not least, PPAs provide customers with the ability to generate clean, renewable energy. While this is reward enough for the environmentally-conscious, this presents a positive public relations image even for those that are not. More practically, with Congress currently debating cap-and-trade legislation that would require companies to purchase credits to offset their carbon emissions, this could translate into a financial benefit in the future as well.
-
Net Metering revenue: Finally, many states are beginning to institute net metering programs which require utilities to refund customers for the surplus energy that their onsite renewable energy installations generate and return to the grid. As most PPA providers sell all the electricity generated at one rate to the customer, the customer would benefit from any net metering revenue, assuming it is located in a state that allows it.
On the flip side of the coin, the PPA provider receives its share of benefits as well. Though primarily economic in nature, they can be summarized as follows:
-
Federal Renewable Energy Tax Credit/Grant: As part of the American Recovery and Reinvestment Act of 2009, solar projects are eligible for a tax credit—or grant—of 30% of the total cost of installation. As the legal owner of record, the PPA provider is the recipient of this benefit. Since this is paid 60 days after the later of the date the application is filed or the date the projects is completed, this effectively reduces the cost of the system by almost one-third within the first year the investment is made.xv
-
MACRS: In addition, solar installations qualify for use of the Modified Accelerated Cost-Recovery System [MACRS] for calculating depreciation for tax purposes. While traditional depreciation may spread this cost over 20 years, MACRs allows for the depreciation of the entire installation cost over 5 years. Of note, depreciation must be calculated off of the capital cost net of 50% of the federal tax credit/grant. A Lawrence Berkeley National Laboratories report estimates that on a present value basis, this equates to an offset of an additional 26% of the total installation cost.xvi
-
State and Local rebates: In many states, additional rebates are awarded that offset some of the total installation cost of the system. For instance, California offers a $1.55 per watt rebate to new solar installations.
-
Fixed, predictable revenue stream: Based on whatever rate the customer is charged, the PPA will generate a steady stream of monthly “subscription” revenue over the 10-20 year life of the agreement. As the PPA provider will inherently set rates to generate a positive NPV on its net capital investment, this should ultimately culminate in an economic return on investment that exceeds its cost of capital.
By Expanding the Pie, PPAs Create Value along the Whole Supply Chain
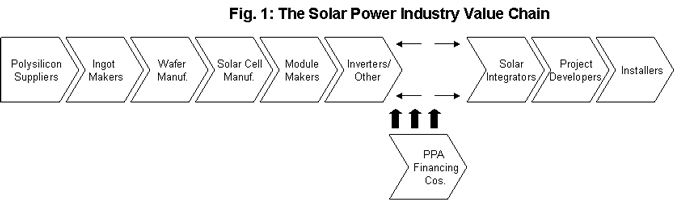
Though it is clear that PPAs benefit both sides of the transaction, the other key question is how they affect the rest of the supply chain since they effectively bring in a new player to the ballgame. Historically, the value chain has consisted of eight core members that contribute to the development of a solar power system. The value chain begins upstream with (1) the providers of the raw material polysilicon, which is then processed into a useful form by (2) the ingot and wafer manufacturers. The wafers are then used by (3) the solar cell manufacturers and ultimately (4) the solar module makers to build the finished solar panel product, while (5) the inverter and other “balance of system” component makers produce everything else needed to complete the system. The downstream process begins with (6) the solar integrators and/or (7) the project developers who design the system and pass it down to the (8) installers who complete the project.
With the use of a PPAs, the solar power value chain relies upon one additional member: the PPA provider. Aside from arranging—and ultimately providing—the financing, the PPA provider has begun to emerge as the central hub around which the rest of the installation players revolve. After securing a deal with a customer, it is the PPA provider that assembles the network of necessary constituents throughout the rest of the value chain, including the suppliers, 3rd party investors, and ultimately the designers and installers. By dealing with the financing, the permitting and zoning, the applications for the relevant tax incentives and subsidies from the government, and ultimately exploring net metering with the local utility, PPA providers are playing an increasingly crucial role in the creation and completion of new projects. xvii
In light of the larger role that PPA providers are playing in the market, the key question is if they pose a threat to the rest of the value chain. Is this new entrant merely capturing value that has been redistributed from the other members? In other industries, a new entrant to the value chain often acts as a force of disintermediation that captures more value for itself by squeezing out other links in the chain.
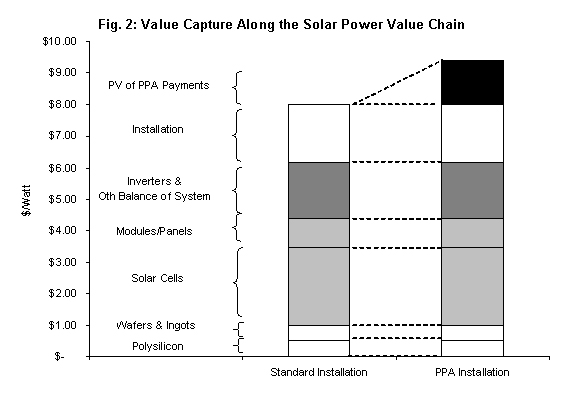
- What is remarkable about the PPA structure is that it leads to value creation and not value redistribution. The total value that the PPA provider captures is entirely created by the PPA structure itself and is not value taken from somewhere else along the chain. The PPA provider pays the full price of that system, and thus the value captured by the rest of the supply chain remains unaltered. The extra value that the PPA provider captures ultimately comes from the customer paying more in aggregate over the life of the system than the cost of the initial installation in exchange for the right to finance it and not pay the upfront cost (see Figure 2).
Since the PPA structure effectively opens up the addressable market for solar to those who otherwise wouldn’t be able or willing to pay the steep upfront cost of installation, it is expanding the pie for the other players of the value chain. Moreover, PPAs create tremendous value for non-taxable entites that invest in the projects, as they would otherwise not be eligible to receive any tax incentives.
PPAs Are Forecast to Drive 2.3 GW in Annual Solar Installations by 2013
By offering a solution the entire industry has been seeking, PPAs have been embraced in force over the last few years. Prior to 2007, the vast majority of solar projects were self-financed and in many cases paid for in cash. Toward the end of 2006, however, PPAs emerged as a popular tool and immediately had a transformational impact on the solar power industry.
SunEdison, the pioneer of the solar PPA, launched its first PPA in 2004. In its first couple years in business, SunEdison put PPAs on the map after inking deals with a few major national retailers including Whole Foods, Ikea, and Staples.xviii It was in April 2007, however, that the PPA structure really made headlines when Kohl’s Department Stores signed a PPA with SunEdison in what became the largest rooftop solar rollout in US history. With no upfront capital outlay, Kohl’s was able to secure about 25 MW of solar capacity on the rooftops of 65 of its stores throughout California, now generating roughly 20-30% of each store’s electricity at a fixed rate that is less than each store’s local utility rate for the next 20 years.xix
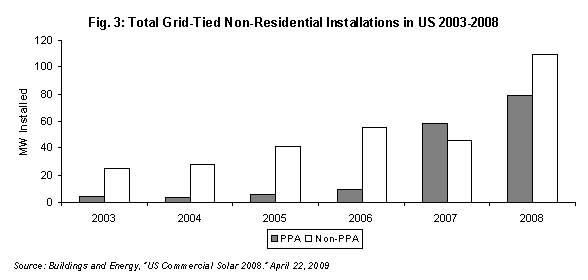
- This helped kick off tremendous growth for PPAs. In 2007, non-residential solar installations in the US grew 63% to 104 MW, more than half of which—58 MW—were financed through PPAs.xx Though the financial crisis and unfounded concerns about lower government incentives led to a drop in share of the non-residential installation market in 2008, PPA-financed installations nonetheless grew 36% to 79 MW. By the end of 2008, according to AltaTerra research, PPAs were accounting for 72% of commercial solar installations in the US.xxi
SunEdison, the leading PPA provider in the country, now operates about 300 installations with more than 80 MW of peak capacity for customers including Macy’s, Costco and Wal-Mart.xxii Validating the promise and profitability of the PPA business model, solar wafer producer MEMC Electronic Materials agreed to buy SunEdison for $200 million in October 2009, while Fotowatio bought MMA Renewable Ventures, a PPA project developer, in March 2009. Some of the other independent PPAs providers that stand to benefit from the market’s growth include Tioga Energy, Solar Power Partners, Photon Energy Services, and Recurrent Energy.
Looking ahead, AltaTerra expects PPAs to enter a “hypergrowth” phase over the next decade as they become a core driver of deeper solar penetration throughout the country.xxiii In a September 2009 report, Gartner forecast the US market for PPAs to grow at an annual rate of over 100% to reach $8 billion in new installations over the next five years, culminating in 2.3-GW of installations by 2013.xxiv
The Economics Are Driven By Tax Incentives and a Low Cost of Capital
To get a firm handle on the drivers—and thus the constraints—of the PPA market, it is critical to not lose sight of the fact that PPAs are nothing more than a financing tool and are thus driven by economics more than anything else. This financial structure is simply not feasible unless it yields an internal rate of return [IRR] that exceeds the PPA investor’s “hurdle rate,” or required rate of return. Phrased another way, PPAs must be structured in a manner that generates a positive net present value, where the present value of the monthly cash flow from the project exceeds the upfront cash investment in the installation. The three most influential variables that drive the NPV of a PPA are: (1) revenue, (2) net capital investment, and (3) the cost of capital.
Revenue is for the most part determined by the rate the PPA provider charges the customer akin to a monthly utility bill. However, since PPAs must be priced so they are competitive with the local utility rate, it is likely not a tool that can be easily manipulated. Any supplemental revenue, such as the sale of Renewable Energy Credits, would serve to boost returns. Net metering offers another possibility, though usually PPAs are structured so that the customer receives this benefit. xxv
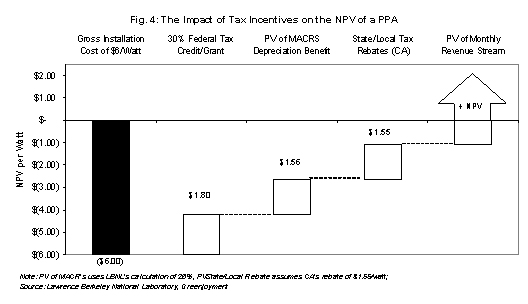
The net capital investment in a project can be simplistically conceived as the gross cost of the installation net of any offsetting upfront tax benefits and rebates. The gross cost of the system is determined ultimately by market prices for solar modules, “balance of systems” equipment, and the cost of installation. As larger installations spread out fixed costs over higher output, scale is an important factor in lowering cost per MW. Everything else being equal, however, it is the various federal, state, and local tax incentives that ultimately have the most impact in reducing a PPA provider’s net cash investment in a solar installation project. As Figure 4 below highlights, (1) the federal 30% tax credit/grant, (2) the benefit of accelerated depreciation under MACRs, and (3) potential state and local tax rebates could offset more than 80% of the total cash outlay for the installation of the system. Without these incentives, in fact, reasonably-priced PPAs would almost certainly not generate a positive net present value.
The final critical variable that drives the NPV of a PPA is the cost of capital. Since the PPA is ultimately nothing more than a financing tool, the cost of capital can in some sense be considered the “cost of goods sold.” All else equal, the lower the cost of capital, the higher the NPV, and if high enough it can make a project altogether untenable. As a result, a low cost of capital is one of the primary competitive advantages a PPA provider can have and a defining characteristic of a viable PPA business model. Most equity investors assume a 12-15% discount rate for a PPA project. However, most PPAs will not generate a positive NPV with a cost of capital as high as this. As a result, most PPAs require the use of leverage to generate a positive NPV and thus an internal rate of return (IRR) that exceeds its required rate of return.
With this in mind, the terms under which PPA providers arrange 3rd party financing has an enormous impact on the profitability and viability of a project. For the most part, PPA financing is set up in one of two ways. In what is often referred to as the “Master Lease model,” the PPA provider itself will not own the project. Instead, in order to secure 3rd party financing, it will cede ownership in the project to the banks, lenders, and/or other tax equity investors that fund the project. Under this scenario, all of the government incentives, including the 30% tax credit/grant, state and local rebates, and the depreciation benefits fall to the financing companies. For its part, the PPA provider oversees and manages the project and collects the revenue directly from the customer. Its profits are effectively that revenue net of the financing costs.xxvi SunEdison utilizes this business model; it does not own any of its projects and instead relinquishes all of the tax benefits and incentives to the financing companies who are the project’s owner of record. SunEdison merely pockets a development fee and reimbursement of its servicing expenses.xxvii
In the other model, known as the “Flip model,” the investors and the PPA provider work in partnership. Though the PPA provider still manages the project, it will likely also take part in the financing and in turn own a minority stake in the investment. However, the investors will in all likelihood retain a majority stake and thus all of the tax incentives as well. After about 6-7 years, majority ownership in the project will “flip” from the investor to the PPA provider. xxviii
Clouds Still Cast Shadows over Some Areas of the Marketplace
Because of the constraints created by these economics, the sky is not the limit for PPAs. Even with all the benefits they bestow upon the customer, the provider, and the rest of the value chain, PPAs simply cannot be all things to all people. Not every customer will qualify, not every project is viable, and, dependent upon such lavish tax incentives, the good times certainly won’t last forever. In representing such a large financial investment over a multi-decade period, PPAs require a major commitment from both the PPA providers and customers. With such commitment comes a great deal of risk as well. This final section explores the most predominant concerns, constraints, and limitations of PPAs, which may hold it back from growing to its full potential.
- Complications for the Customer Could Serve as High Hurdles to Overcome
Though a PPA ultimately aims to simplify the installation process for the customer, there are nonetheless many complications that could arise that may jeopardize a customer’s willingness to sign on the dotted line. First and foremost may be reluctance—or even worse an inability—to enter into a multi-decade commitment. Since a PPA creates a long-term obligation for the customer, it will severely limit a customer’s flexibility to move locations over the duration of the agreement and may complicate its ability to sell or sublease the space or for that matter make improvements or renovations that would interfere with the system. Ironically, despite the visibility into long-term electricity costs that PPAs provide, a customer may simply not have the operational visibility or even ability—legal or otherwise—to commit for such a long period. To help address some of this concern, most PPAs offer standard “end of contract” options that tend to favor the customer. Aside from being offered a contract extension or the option to purchase the system outright at market value, the customer could also choose to have the PPA provider uninstall the system at its own expense (though it is often more cost effective for the PPA provider to simply “abandon it in place.” xxix
On top of that, some PPAs could have “hidden costs” that may serve as a snag in some negotiations. These include (1) the possible requirement that the customer pays for the inverter replacement if needed during the life of the deal, (2) a potential hike in property taxes that may result if the property is reassessed at a higher value because of the system, (3) higher insurance rates if the PPA provider requires the system be insured directly by the customer, and (3) higher transaction and administrative costs for negotiating the agreement and dealing with two electricity bills. While these complications may not be an issue for some, they may be inhibitive for others.
The Addressable Market for PPAs Is Limited to Customers with Very Specific Criteria…
On the flip side, from the PPA provider’s perspective, economic viability takes priority over everything else, so the target market is essentially confined to a narrow scope of customers that carry certain attributes which serve to minimize risk and perhaps maximize returns on a project. Specifically, PPA providers tend to exclusively target customers that are:
-
Creditworthy and financial stable
-
Owners of the property (though some will settle for long-term tenants or leaseholders with 10-20 year visibility)
-
Moderate-to-high energy users during peak periods
-
Large enough to offer sufficient scale to make the economics work
Absent all of these criteria, the viability of a 20-year PPA may be considered at risk. As a result, even able and willing customers that offer some but not all of these attributes will likely be left out of the PPA market. Though it is difficult to estimate how much demand this may eliminate, it will certainly cap the market’s ultimate growth prospects.
…Which Effectively Closes the PPA Market to Installations Below 100-kW
The most prominent of these criteria is the project’s size. On the whole, the bulk of the PPA market has been limited to installations of 100 kW or larger. Not only must smaller projects deal with higher per watt installation costs but they also must cope with roughly the same level of transaction costs as larger projects do. More so than self-financed installations, PPAs entail hefty transaction costs to address the many credit and legal risks arising from the long duration of the deals and the tax incentives involved. The larger the installation the more these fixed costs can be amortized over the cost of the whole project, providing large commercial or utility projects the economies of scale needed to bring them closer to grid parity and economic viability.
While SolarTech, an industry consortium, recently introduced a standardized PPA contract template in an effort to lower transaction costs, it ultimately won’t eliminate them altogether. As a result, smaller installations are often left out of the equation for most PPA providers. Residential installations are neither large enough nor homogenous enough to offer an attractive structure to the PPA servicers and financing companies. They demand a high volume of small loans with low margins, which translates into more customers, more paperwork, and a decentralized maintenance operation that is more expensive to run. As a case in point, Akeena Solar was advised to stay out of the residential PPA market.xxx Other prominent PPA providers, such as Tioga Energy, limit their offerings to 100-kW or larger.
Over the next ten years, perhaps the single most unequivocal driver of higher solar penetration in the US are Renewable Portfolio Standards [RPS], which set a minimum level of electricity that must be produced from renewable sources. California already has one in place, and the pending climate legislation before Congress will likely include one with a 15-20% mandate by 2020. Clearly, large commercial and utility-scale installations offer the most “bang for the buck” in meeting this requirement, as a single 1-MW installation is much easier to arrange than 200 5-kW projects. However, there are far more customers in the 5-50kW range than above 500-kW; in aggregate it is an enormous market that is currently not being served.
How can the PPA market viably access this huge untapped market? A stronger platform for residential PPAs is one answer. Two companies, SunRun and SolarCity, already offer a structure that appears to profitably address the residential market. Some argue they more closely resemble a “solar lease” than a PPA because payments are often fixed and not limited to actual energy produced, they may not cover maintenance costs, and some even require an upfront down payment that could run as high as 30% of the installation cost.xxxi Nevertheless, they are still forms of 3rd party finance that help reduce the upfront cost and provide access to solar to those who otherwise would not have it. The bigger issue, however, is that to date these “residential PPAs” are limited to very few markets. Between the two companies, only the California, Arizona, Oregon, and Massachusetts markets are served. Major residential PPA offerings in other key markets have yet to emerge in force.
Another option is the use of “community solar”. An idea championed by Paul Fenn of Local Power, a PPA provider could aggregate a large number of small single-digit kW systems into one large installation that is the equivalent to one multi-hundred kW commercial installation. Not only would this bring in the economies of scale necessary to make the PPA model viable, but it also is an ideal use of “distributed power”—the generation of power close to the point at which it is being used—which not only reduces transmission costs but is also a much more efficient use of energy. Though this approach has been tested in some small markets, such as in Ashland, OR and Ellensuburg, WA, it has yet to be adopted on a widespread basis.xxxii
- PPA Financing Still Heavily Dependent upon Healthy Capital Markets
As PPAs are above everything else a source of capital, the subsistence of this market is wholly dependent upon freely-flowing and properly-functioning capital markets. The dysfunction in the financial markets since Lehman’s collapse in September 2008 has undeniably had an adverse impact on the availability of capital. Though credit markets have thawed from their frozen state last winter, they have yet to completely return to normalcy. As a result, PPAs are driving a smaller proportion of the installation market recently than they did for most of last year.
Looking ahead, growth in the PPA market will in large part depend upon the continued normalization of the capital markets. Though the benefits of tax incentives, lower solar module prices, and greater confidence in an economic recovery should lower the risk profile of PPA projects and entice more investors into the game, the risk of a resurgence in bank write-downs and a widening in credit spreads could spell further trouble for PPA project financing.
- PPA Market Could Hit a Wall after the Expiration of the 30% Tax Grant at the End of 2010
One distinct cloud hanging over the near-term horizon is the expiration of the 30% tax grant after December 2010. One of the primary benefits PPAs bring to investors—and thus a primary driver of PPA financing—is the federal tax incentive that reimburses investors for 30% of the installation cost of qualified renewable energy projects. What is so powerful about this measure is that it not only is offered as a tax credit but also as an outright cash grant if the investor in the project does not have sufficient tax liabilities to offset. However, the cash grant portion of this benefit expires after two years when it will revert strictly to a tax credit.
To avoid any notable disruption to the PPA financing market, the expiration of the tax grant must rely upon the reemergence of a tax equity investor base before then. The pool of tax equity investors, which have been a prominent source of PPA project financing over the years, withered over the last year because of the deterioration of the capital markets and the subsequent vanishing of taxable profits to offset. The expiration of the tax grant assumes that the resurgence in the capital markets that gathered steam over the second half of 2009 will carry through 2010 and be enough to rebuild the base of tax equity investors needed to support the renewable energy project finance market. However, a double-dip recession and a reignited credit crunch might preclude this from happening. In this case, if the grant is not extended, there is a very real risk that the PPA market—and the installation market as a whole—falls off a cliff as we enter 2011.
Soft Natural Gas Prices Could Make PPAs Less Attractive
Another risk is that persistent softness in natural gas prices could drive electricity rates low enough that PPAs cannot be priced at levels that generate sufficient economic returns. Since the turn of the year, a drop in demand from the weak economy coupled with record inventories driven by new drilling discoveries has driven natural gas from a high of close to $12.50 per BTU in mid-2008 to below $5.00 recently. Though prices have since come off their lows, high inventories are expected to persist and keep a lid on market rates for electricity; this would make solar less attractive. To be clear, lower electricity prices are not the only motive behind installing solar power, and renewable portfolio standards should be sufficient to drive the market. Nevertheless, low prices will make PPAs less attractive and possibly scare some investors away.
- High PPA Prices Could Drive Utilities to Self-Finance Their Own Projects
An emerging—and oft-overlooked—risk is that the PPA providers price themselves out of the market. With the credit markets still tight and PPAs providing the crucial capital needed to finance many solar projects, some PPA providers have begun to wield greater pricing power. According to a Gartner report on the PPA market, “the PV PPA firms that can continue to build their financing pipeline will be in a position to dictate the terms to the PV industry for the near-term future.”xxxiii While this may lead to higher prices in some projects, it may simply lead to a wide bid-ask spread for PPAs in others.
As highlighted above, large commercial and utility projects are both the sweet spot for the PPA market and the most direct route to meeting approaching deadlines for state—and possibly federal—RPS. Ironically, however, these same customers have both the availability and, in many cases, a low enough cost of capital to consider self-financing their solar projects as well. If the IRR of a PPA is attractive enough, it will only be more attractive for a self-financed project if enough capital is available. With the full array of available tax incentives and plummeting prices for solar modules, the payback period has truncated to less than five years in some cases. To date, the evidence is to the contrary; Southern California Edison announced an enormous 550-MW PPA with First Solar in August 2009. Moreover, as the utility market for solar power continues to develop, it is likely that utilities revert to their primary role as a distributor and not generator of energy, instead buying from independent power producers (IPPs), such as Constellation Energy and NRG. As is evident in NRG’s purchase of First Solar’s 21-MW Blythe project, which is operating under a PPA with Southern California Edison, IPPs are prone to continue to use the PPA structure.
Rain or Shine…Economics is the Name of the Game
In conclusion, PPAs offer a truly compelling and viable means to circumvent the most prominent obstacle to installing solar: the high upfront cost of installation. By providing customers an inexpensive foray into solar power generation for customers and investors an ample IRR, PPAs have vastly inflated solar’s addressable market and thus created value throughout the entire solar power value chain.
Still, the road is not wide open ahead. The ability for PPAs to generate a sufficient IRR to a large extent rests upon healthy capital markets, a supportive tax regime, and finding the proper balance that accommodates both their customers’ needs and their investors’ constraints. Though the sun will surely come out tomorrow, only economics will decide how bright it shines on the prospects for the PPA market.
- Sources
The content & opinions in this article are the author’s and do not necessarily represent the views of AltEnergyMag
Comments (0)
This post does not have any comments. Be the first to leave a comment below.
Featured Product