This article examines the hidden power-loss case study data from a utility scale array. The role of string-level monitoring in identifying hidden power losses and its use as a tool in maintaining a high-level PV array operational reliability will be discussed.
Improving Utility Scale PV Plant Operational Reliability via Effective Monitoring
Daniel J. Sylawa And Lotte Ehlers | Phoenix Contact USA, Inc.
As the number of utility scale PV plants continues to grow, increased emphasis is being placed on improving array operational reliability. These improvements are often focused on key factors, such as maximizing power production, minimizing operations and maintenance costs (O&M), and maximizing array performance ratio (actual annual array AC output in KWh/annual targeted design DC array output in KWh). Classes of array stakeholders, such as owners, operators and investors, may have different interests in array performance. However, all have an interest in controlling array variability. Increasing array visibility by techniques such as string-level monitoring has proven an effective tool in optimizing PV system performance and reliability.
The level of array monitoring granularity is often a subject of discussion. However, all agree the string-level current monitoring offers maximum visibility into array performance. String-level monitoring can play an important role in the identification of hidden array losses, as well as assisting in locating array failure points and minimizing O&M costs. This has become increasingly vital as utility scale PV plant array overall installation sizes and the number of central inverter connected strings has grown.
This article examines the hidden power-loss case study data from a utility scale array located in Brussels, Belgium. The role of string-level monitoring in identifying hidden power losses and its use as a tool in maintaining a high-level PV array operational reliability will be discussed. Associated revenue losses will be examined, and an estimation will be made of the potential rate of return by employing string-level monitoring.
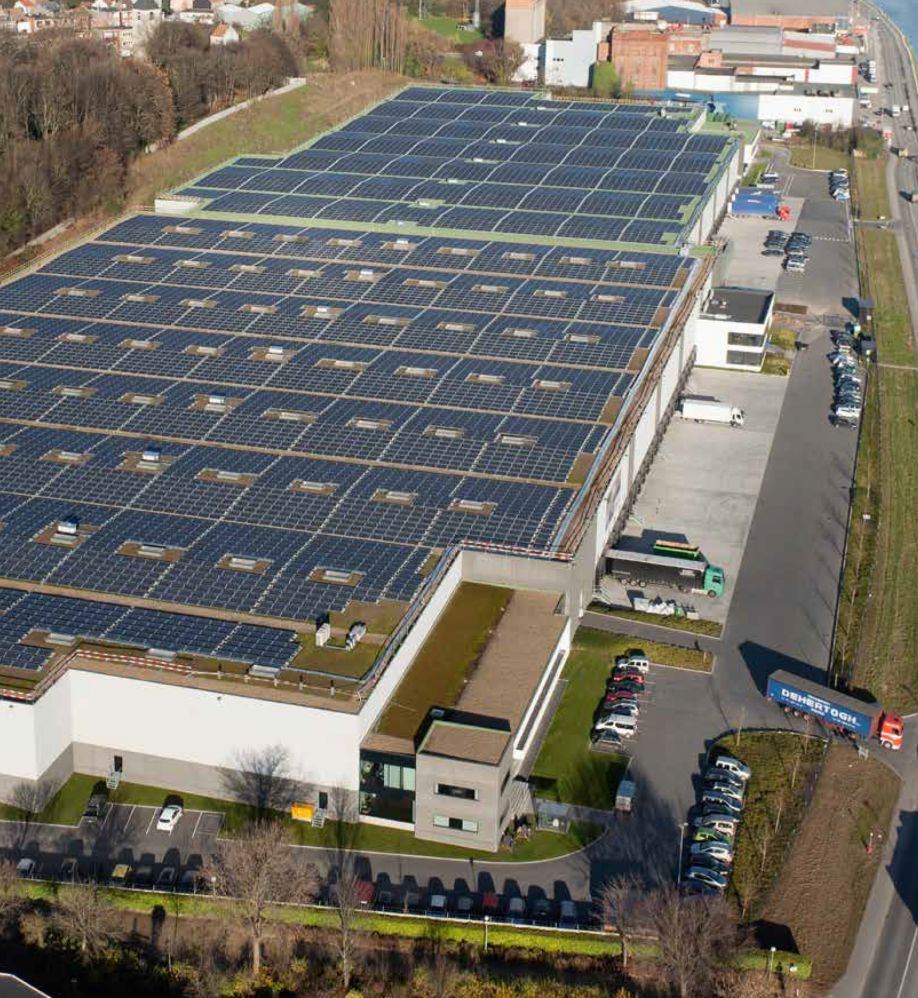
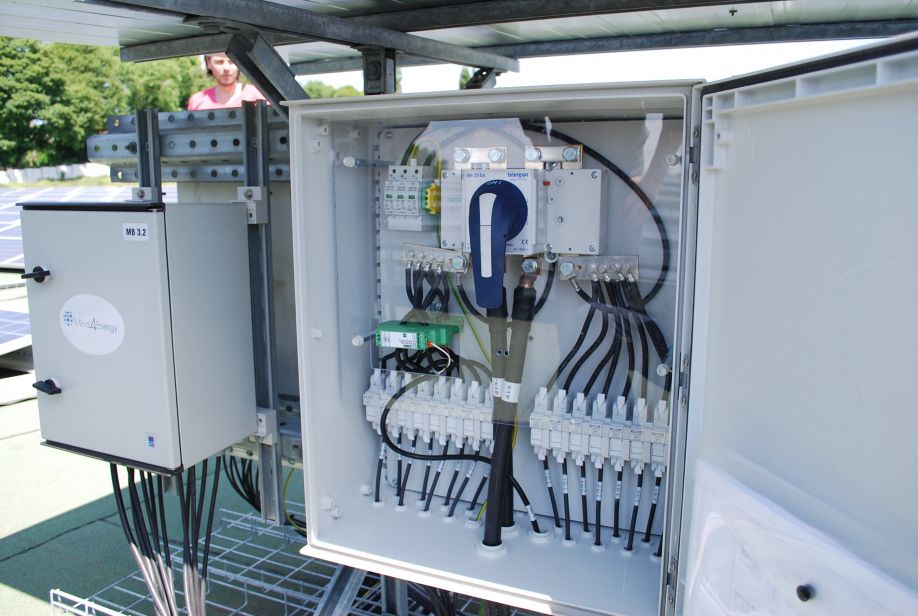
Canal Logistics 3.5 MWp array and combiner box with string-level monitoring.
Utility scale array information
Installation location: Canal Logistics, Brussels, Belgium
Installation type: Rooftop
Array capacity: 3.5 MWp
Annual AC productions: 3.15 GWh
Total number of solar panels: 14,220
Total number of array strings: 719
Inverters, number and types: (4) 800 kVA, (1) 80 kVA
Array monitoring: Phoenix Contact SOLARCHECK string-level monitoring linked to a Mind4Energy Powermonitor Web-based array monitoring and visualization system.
Array power-loss case study
Complete string power loss
During March 2014 the array monitoring system for the installation in Brussels, Belgium, reported a complete loss of power on six strings. One failure was the complete loss of a five-string combiner box connected to inverter #4.
The other failure was one string within a larger combiner box connected to inverter #3. Inverter #3 and #4 are 800 kVA rating with an average of 175 strings connected to each. Due to the low accuracy level reading of the inverter MPPT inputs, array performance variations and varying cloud cover, no definitive power loss trend could be deduced from the inverter real-time power output curves.
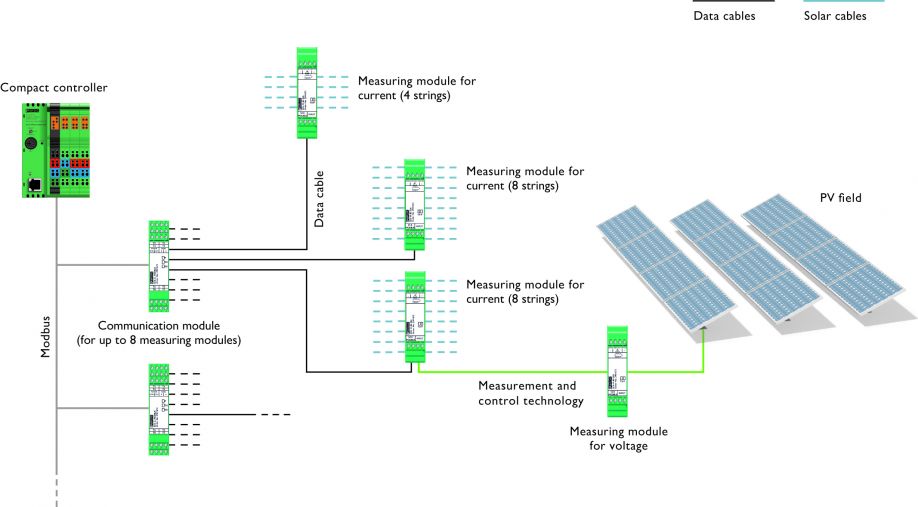
String-level current and array voltage measurement system.
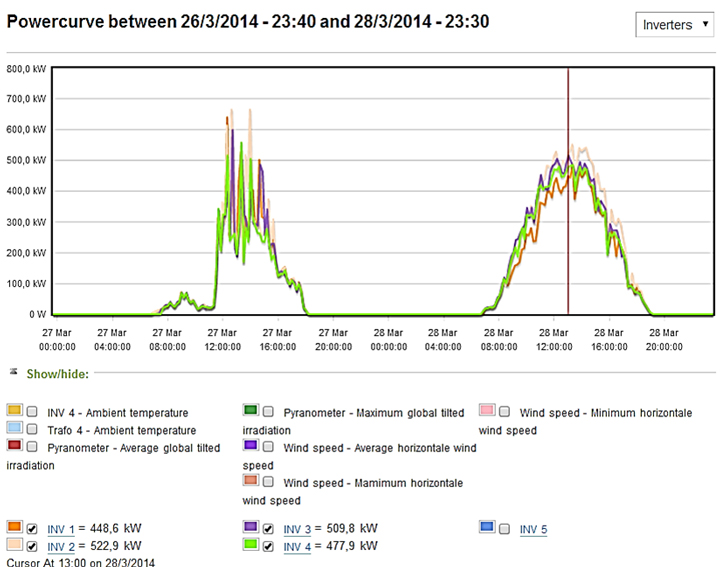
Array real-time output power curve for the 800 kVA inverters
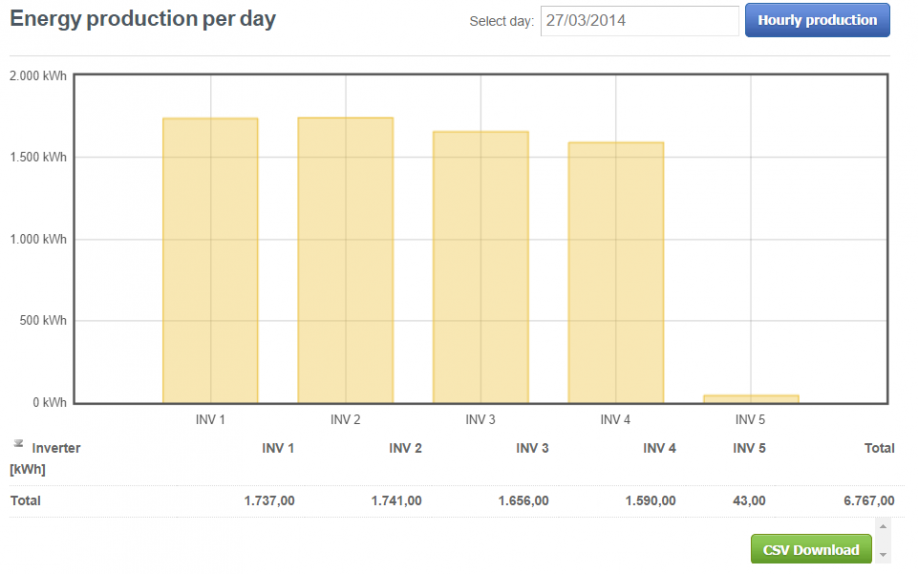
Daily 800 kVA inverter production data for March 27, 2014.
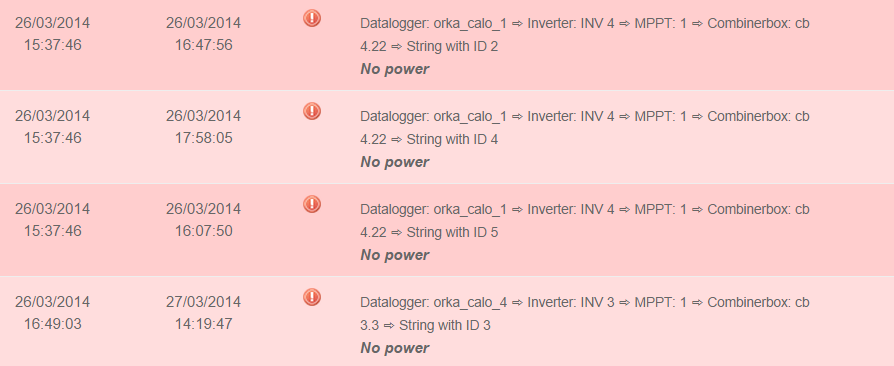
Typical string power loss alarms generated by the array monitoring system.

Combiner box 4.22, complete five-string failure.
An examination of daily power production data for the array yielded similar results. Comparing the average daily productions for all of the 800 kVA inverters during the time when all six strings had failed with the output of each inverter yielded the follow results:
Average daily production: 1681 kWh
Inverter #1 production difference from average: +3.0%
Inverter #2 production difference from average: +3.5%
Inverter #3 production difference from average: - 1.5%
Inverter #4 production difference from average: - 5.5%
Due to the aforementioned array variations, production alarms are typically set at an action level of +10% or greater. As a result no alarm was triggered by the string losses.
A check of the string-level monitoring data clearly revealed the string failures. The Figure 5 alarms generated by this data would accurately reflect the string power loss while minimizing the influence of array performance variations. A further examination of the individual string-output curves further identified the failure.
Partial string power loss
While not part of this study, partial string power loss will produce similar results to the complete power loss case. Due to the lower potential impact on overall inverter power production, these losses can only be discovered by string-level monitoring.
Estimated economic effects
Based on current electricity pricing in Belgium (0.29€/kWh) and the power output of the individual 800 kVA inverter strings, an approximate loss may be estimated for the six strings with complete power loss:
Total power output loss for 6 strings: 30 kWp
Total loss for 1 month: 2.40 MWh or ~ 600€
Total loss for 6 months: 14.25 MWh or ~ 4133€
Total loss for 1 year: 28.5 MWh or ~ 8265€
Based on an average of $0.12/kWh US electricity and the current exchange rate ($1.20/€) the equivalent economic losses within the United States would be approximately $292 for one month, $1,710 for six months and $3,420 for one year.
Based on these losses, it is also possible to perform a straight- line estimation of the rate of return for the installation of string-level monitoring. Taking the US case we get:
Hardware costs to install string-level monitoring: $30/string
Average number of strings per 800 kVA inverter: 175
String-level investment per inverter: 175 x $30 = $5250
One month economic loss for 6 strings: $288
Rate of return period: $5250/$288 = 18 months
This rate of return is valid for any cumulative 18-month loss period over the 25-year (300-month) lifetime of the array.These are estimated calculations and do not take into account interest rates, changes in electric power rates or other economic assumptions.
String-level monitoring provides maximum visibility into array performance and can be a key component of an effective array monitoring system. There are positive economic effects based on hidden array power losses. While O&M costs will have an influence on the decision to repair, the employment of string-level monitoring can be of valuable assistance in the repair process. Effective monitoring can be an important element in maximizing power production, minimizing O&M costs and maximizing array performance ratio. These operational reliability components can be of valued interest to strategic array stakeholders such as owners, operators and investors.
Acknowledgment
We would like to thank Mr. Eduardo Diaz of Mind4Energy in Gent, Belgium, for his valuable assistance in procuring data for this paper, as well as his insights into monitoring and array performance.
The content & opinions in this article are the author’s and do not necessarily represent the views of AltEnergyMag
Comments (0)
This post does not have any comments. Be the first to leave a comment below.
Featured Product


