This white paper takes a novel, nationwide approach to estimating an overall impact on emissions and cost. It sheds light on the role that energy efficiency can play as a compliance mechanism.
EPA 111(d) Clean Power Plan Could Increase Energy Efficiency Impacts, Net Benefits, and Total Value
David Pickles, Bill Prindle, Chris MacCracken, Steven Fine, and Phil Mihlmester | ICF International
Executive Summary
The release of EPA’s much anticipated Clean Power Plan proposal starts the clock on what will be a multiyear process of review, analysis, planning, and implementation for states, affected sources, and other stakeholders. Depending on the outcome of this process and the methods by which states choose to comply, nationwide annual expenditures on utility energy efficiency programs could increase threefold, and the net electric system benefits from these programs could increase as much as $12.1/MWh or approximately 15 percent by 2030 solely due to their compliance value. These benefits would not only reduce the total cost of compliance but also reduce power prices. Inclusion of efficiency in Clean Power Plan compliance would make efficiency programs more cost effective and also would increase efficiency’s risk management value to utilities.
The draft EPA rule sets a wide range of state targets. Electricity markets vary greatly across the United States. As a result, the impact of efficiency will vary significantly by state and utility, depending on a host of factors, including the carbon-intensity of the current and planned generation mix, scale of current energy efficiency programs, and cost and availability of other compliance alternatives. Many considerations remain to be resolved, including evaluation, measurement, and verification requirements, regulator and customer response to rate impacts, impact on shareholder incentives, utility compared with third-party administration of programs, integration with existing energy efficiency resource standards, and the scale and cost of achievable efficiency potential. This analysis suggests that energy efficiency may become an increasingly important tool for utility resource planners.
This white paper takes a novel, nationwide approach to estimating an overall impact on emissions and cost. It sheds light on the role that energy efficiency can play as a compliance mechanism.
Quick Background and Timeline
EPA’s proposed Clean Power Plan would regulate carbon dioxide (CO2) emissions of existing generating units through state-level CO2 emission rate standards. EPA derived the standards by evaluating potential options for emission reductions in each state from generating units and across the broader electric sector. EPA estimates that the rule will reduce total U.S. power sector emissions by 30 percent from 2005 levels by 2030.
The rule requires that states submit plans for EPA’s review and approval which identify how they will impose and enforce the specified standards. The rule does not specify which measures each state must use, nor does it specify a required level of emission reductions from each type of measure. Instead, each state must determine its optimal plan design and components. This degree of flexibility offers states tremendous opportunity in shaping their plans. However, states must undertake sophisticated analysis to assess the relative costs and benefits of a wide range of options.
According to the timeline proposed in the Clean Power Plan, initial state plans will be due to EPA for review in 2016, with final plans due for states acting alone in 2017 and for states participating in multistate compliance groups in 2018. However, given the complex process of developing new rules and programs, states, sources, and stakeholders should initiate their efforts now. They must continue those efforts through the several stages that will comprise the entire rulemaking process. Those stages will include providing comments on the proposed rule, due December 1, 2014, through the release and review of the final rule expected in June 2015, and to the development and submission of the plans.
First Order of Business: Understanding the Building Blocks to BSER
The Clean Air Act requires that EPA identify the “best system of emission reduction” (BSER), taking into account the costs and benefits associated with potential reductions in CO2 emission rates. In the Clean Power Plan, EPA did not define BSER as a unit- or facility-specific requirement, nor as a single policy or measure. Instead, it took a broader “beyond the fence” view, identifying four “building blocks” of BSER that incorporate reduction measures both inside and outside the footprint of the affected generators (including energy efficiency), as shown in Table 1.
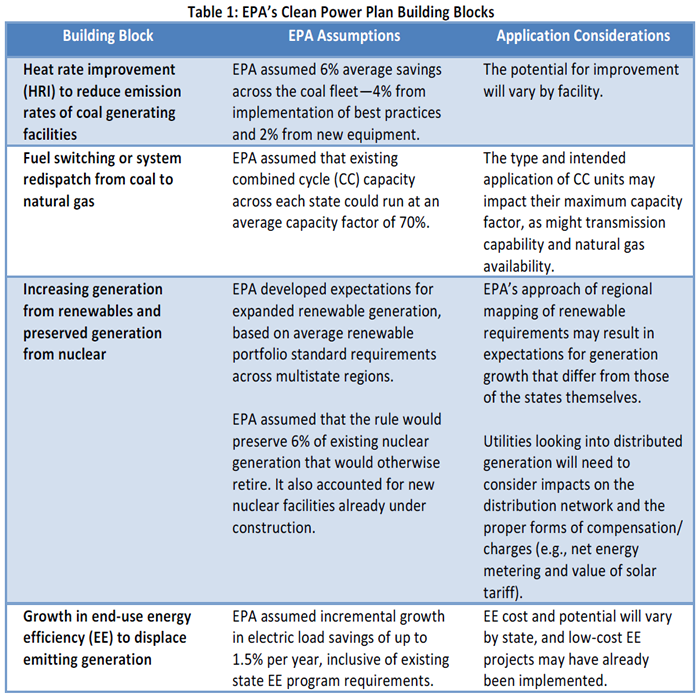
The estimated cost range for each building block assumed by EPA is provided in Figure 1.1 Energy efficiency shows a lower average cost of compliance than the power generation resource options. Although the heat rate improvement shows a lower average cost, in many cases it has very limited emission reduction potential. As shown in Figure 2, it makes up a very small share of total emission reductions in a typical state.
Although EPA used these four building blocks in developing state emission reduction targets, the draft rule does not require or limit states to using these specific resources in their compliance plans. Moreover, the relative costs of compliance will vary from state to state. This flexibility creates an opportunity for states and stakeholders to find the lowest-cost compliance options that support their economic and policy goals.
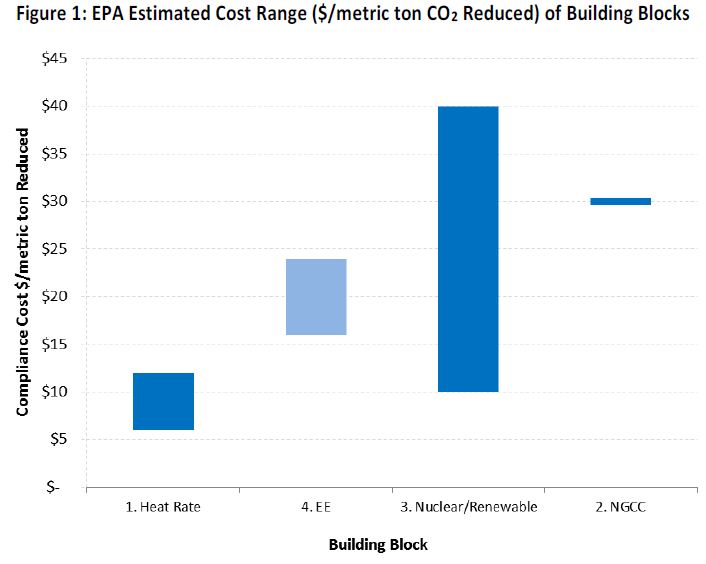
Figure 2 summarizes the state-by-state emission reduction targets developed in EPA’s draft rule, with each vertical bar composed of varying levels of reductions associated with each of the four building blocks. As the graphic illustrates, efficiency varies both in total magnitude and as a percentage of total contribution to the emission reduction target. The analysis associated with the rule takes into account the current and expected availability of resources in each building block. The analysis includes varying assumptions about current and projected efficiency program impacts. However, these building block-based estimates do not denote states’ actual compliance decisions, because states have flexibility in attaining their targets, and states’ choice of compliance paths as well as resource types will affect electricity market impacts. This efficiency-focused analysis, therefore, seeks to assess the likely impacts of efficiency in a compliance framework.

Quantifying the Value of Energy Efficiency as a Compliance Mechanism
For this analysis, ICF used its Integrated Planning Model (IPM®) to project the impacts of the Clean Power Plan’s energy savings estimates. Four cases3 were run: a “Frozen EE” scenario assuming that savings and spending levels stay at 2012 levels and an “Additional EE” scenario assuming penetration at the levels that EPA assumed in its Regulatory Impact Assessment.4 Each pairing (Frozen EE and Additional EE) was evaluated under both a CO2 compliance case and a non-CO2 compliance case. Based on those assumptions, IPM generated national estimates of CO2 emissions and total system costs for each case.
The difference in system cost savings (defined as the subtraction of system costs in the Additional EE case from the system costs in the Frozen EE case) between the CO2 and non-CO2 scenarios provides an estimate of the incremental value of additional EE when used as a compliance mechanism. Note that these savings are in addition to the avoided capacity and energy cost savings provided by the additional EE. Results of the analysis are shown in Table 2.
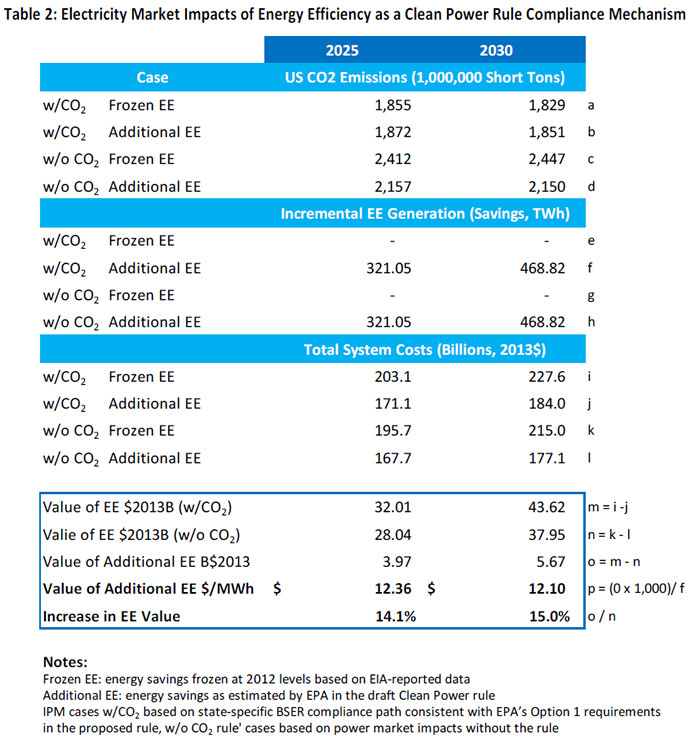
As suggested by Table 2, in 2030 the system cost savings due to additional EE are $5.67 billion greater when EE is used as a CO2 compliance mechanism (due to EE’s ability to displace other, more expensive compliance options). Put another way, the incremental value of additional EE as a compliance option in 2030 is $12.10/additional MWh saved. It serves to increase the overall value of EE (the combination of avoided capacity, avoided energy, and avoided compliance costs) by 15 percent. Although EE program costs are not included in Table 2, they do not affect the change in total system costs, or the net added benefit EE provides, from the non-CO2 rule to the CO2-rule case.
Interestingly, energy efficiency does not by itself reduce emissions in a tradable emissions rate framework. The analysis shows cumulative electricity savings of about 5 percent by 2025 in the Additional EE scenario relative to the Frozen EE scenario. In the CO2 compliance scenarios, cumulative CO2 emissions during the same period increase slightly in the Additional EE scenario—by just under 1 percent in 2025. This somewhat counterintuitive finding is a function of policy design. Under the tradable credit system assumed here, EE generates credits for sale to affected sources that emit above their state standard. Fossil generation units can therefore run more hours with EE impacts growing under the Additional EE scenario. In both compliance cases, however, total reductions in CO2 emissions fall from a business-as-usual case, by more than 20 percent in 2025 and 30 percent in 2030.5
Although these results are valid on a national basis, efficiency savings opportunities vary by state based on current savings and spending levels. Moreover, states face different emission rate targets in the proposed Clean Power Plan and have different resources available with which to comply. They also have great flexibility in developing compliance plans. The following caveats are important to understanding this analysis:
- This analysis is national only. Results for a specific state or region could vary significantly.
- This analysis assumes state-level compliance under a tradable credit-based system similar to EPA’s Option 1-State Case in its Regulatory Impact Assessment. This regulatory design provides credits to sources that generate electricity, or offset generation in the case of efficiency, at emission rates below their state’s standard. Higher-emitting sources demand those credits to reach compliance with the standard, resulting in the state’s reaching the targeted average emission rate. States also could use a total-emissions or “mass-based” compliance path or rely on a portfolio of policy and program solutions. Hybrid paths also are possible; the draft rule is not overly restrictive on compliance pathways. Should a state choose one of these other compliance paths, an analysis like the one in this paper could look different.
Overall, this analysis confirms the value of energy efficiency as a compliance measure. However, it also raises a number of questions that individual states and stakeholders would be well-advised to explore as they consider their compliance strategies, including:
- How would these results differ when applied to a specific state or power market?
- How would these results be affected by a state’s compliance plan choices?
- What would the impacts of higher or lower levels and costs of energy efficiency look like?
- How should utilities address the scale and design of energy efficiency in their planning and risk management associated with 111(d)?
- How should state air regulators, utility regulators, and other stakeholders frame their analyses to determine the appropriate role of energy efficiency in their compliance plans?
ICF will be exploring these and other questions in subsequent analyses.
References
1 Source: Carbon Pollution Guidelines for Existing Power Plants: Emission Guidelines for Greenhouse Gas Emissions From Existing Stationary Sources: Electric Utility Generating Units, 79 Fed. Reg. 34829 (June 18, 2014). Retrieved October 6, 2014, from: https://www.federalregister.gov/articles/2014/06/18/2014-13726/carbon-pollution-emission-guidelines-for-existing-stationary-sources-electric-utility-generating
About the Authors
David Pickles serves as Senior Vice President and Director of Strategy and Business Development for ICF’s Energy Efficiency Division. He also leads ICF’s energy efficiency policy work, including DSM potential studies, regulatory policy, and testimony. He has more than 25 years of experience as a senior executive and utility-industry consultant on energy efficiency and new businesses opportunities. He has testified as an expert witness on more than 25 occasions. He has worked on more than 30 market potential studies and is experienced with energy program design and management, product assessment and business planning, marketing, operations, mergers and acquisitions, strategy, and turnarounds. He has an MS degree in Regulatory Economics from Wyoming University where he also earned a BS in Economics.
William (Bill) Prindle is a Vice President in ICF’s Efficiency Division, leading the division’s policy, program, and technology analytics team. He also supports business development, strategy, and solutions for federal and private clients in the United States and internationally. A recognized leader in the energy efficiency policy field, he has more than 35 years of experience in analysis, advocacy design, and implementation of efficiency policies and programs. He has testified before Congress, state legislatures, and utility commissions; and led projects for federal agencies, electric and gas utilities, corporations, and nonprofit groups. He has served on the boards of numerous energy efficiency nonprofit organizations, including current board membership in the Home Performance Coalition and Virginia’s Local Energy Alliance Program. He holds an MS in Energy Management and Policy from the University of Pennsylvania and a BA in Psychology from Swarthmore College.
Chris MacCracken is a Principal with ICF International’s Energy Advisory & Solutions team. He directs studies examining the impacts of environmental regulation on emission, power and fuel markets, compliance planning, and generating unit valuations. His clients include electric utilities, independent power producers, industry associations, and nonprofit policy organizations. He leads projects related to the development of CO2 standards for existing sources. He is also the lead author of the regulatory chapter in ICF’s quarterly ICForecast publication.
Steven Fine is a Vice President with ICF’s Energy Advisory & Solutions team. At ICF, his work has concentrated on evaluating the economics of conventional and renewable energy resources within the context of developing environmental and energy regulations. He works with many of the major U.S. power companies and developers in assessing the impact of environmental regulatory policies and renewable portfolio standards on unit and fleet compliance, environmental capex, asset valuation, and asset deployment and retirements. He has led ICF’s support of numerous multistakeholder engagements including the Edison Electric Institute’s Regulatory Pathways Analysis, ICF’s AB32 Cap and Trade Study, American Wind Energy Association’s National Wind Study as well as the electric sector analysis for U.S. Climate Action Partnership. He was an invited panelist to a Senate roundtable discussion on the future of federal air regulatory legislation. He works with a number of stakeholders to evaluate the impact of potential New Source Performance Standards policy design at the federal and state level.
Philip Mihlmester serves as Executive Vice President, Global Energy, at ICF International. In this capacity, he oversees the firm’s global energy practice and the efforts of more than 1,300 energy professionals worldwide in the areas of electric power, petroleum, natural gas/LNG, coal, climate change, emissions, energy efficiency and demand-side management, and environmental and water issues. He advises senior corporate and government managers on a variety of strategic issues in the energy sector, including transmission, asset optimization, energy efficiency, and climate issues as well as infrastructure security. He has led project teams in support of major government energy efficiency programs, including EPA Energy Star and the Department of Energy’s Buildings Energy Challenge programs. He also has advised major electric and natural gas utilities on the design, implementation, and evaluation of energy efficiency program portfolios. He holds an MS in Operations Research from the George Washington University and earned his AB at Columbia University.
About ICF International
![]() ICF International (NASDAQ:ICFI) provides professional services and technology solutions that deliver beneficial impact in areas critical to the world's future. ICF is fluent in the language of change, whether driven by markets, technology, or policy. Since 1969, we have combined a passion for our work with deep industry expertise to tackle our clients' most important challenges. We partner with clients around the globe—advising, executing, innovating—to help them define and achieve success. Our more than 4,500 employees serve government and commercial clients from more than 70 offices worldwide. ICF's website is www.icfi.com.
ICF International (NASDAQ:ICFI) provides professional services and technology solutions that deliver beneficial impact in areas critical to the world's future. ICF is fluent in the language of change, whether driven by markets, technology, or policy. Since 1969, we have combined a passion for our work with deep industry expertise to tackle our clients' most important challenges. We partner with clients around the globe—advising, executing, innovating—to help them define and achieve success. Our more than 4,500 employees serve government and commercial clients from more than 70 offices worldwide. ICF's website is www.icfi.com.
©2014
ICF International, Inc. All Rights Reserved.
Any views or opinions expressed in this paper are solely those of the author(s) and do not necessarily represent those of ICF International. This White Paper is provided for informational purposes only and the contents are subject to change without notice. No contractual obligations are formed directly or indirectly by this document. ICF MAKES NO WARRANTIES, EXPRESS, IMPLIED, OR STATUTORY, AS TO THE INFORMATION IN THIS DOCUMENT.
ICF and ICF INTERNATIONAL are registered trademarks of ICF International and/or its affiliates. Other names may be trademarks of their respective owners.
The content & opinions in this article are the author’s and do not necessarily represent the views of AltEnergyMag
Comments (0)
This post does not have any comments. Be the first to leave a comment below.